Rudder Admin

Rudder Analytics got featured on CNBC as one of the leading IT services firms in India
Rudder Analytics has been featured on CNBC as one of the leading IT services firms in India and this is what the analysts had to say about us:
“These companies are the finest examples of outsourced IT services firms in India based on our current book of research,” said Clutch analyst Clayton Kenerson. “All of these companies should be proud of their clients’ reviews – the proof of their professionalism and technical prowess that lends them hard-earned distinction in an otherwise crowded market.”
http://www.cnbc.com/2016/09/08/pr-newswire-clutch-recognizes-leading-it-services-firms-in-india.html
Will QuickSight Kill Tableau?
Over the past years we have seen an exponential increase in the amount of data being generated. On an average, nearly 2.5 quintillion bytes of data was being generated every day in 2012. Extracting actionable insights from such prodigious amount of data can be a nearly impossible task at times.
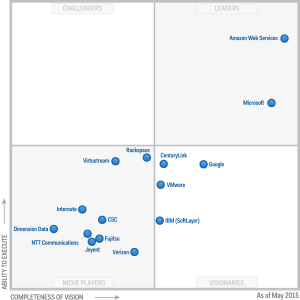 Fig 1: Gartner: Magic Quadrant for Cloud Infrastructure as a Service, Worldwide report, Lydia Leong et al, published 18 May, 2015
Amazon Web Services has been one of the pioneers in catering to the ever-changing data needs of enterprises with its highly scalable and pay-as-you-use services.
AWS senior vice-president, Andy Jassy recently unveiled QuickSight, a brand new service from AWS in Business Intelligence domain, during an annual re-invent conference held for developers. Some of its salient features are
- Extremely fast, cloud-powered, BI service for 1/10th the cost of traditional BI software.
- Fast Calculation with in-built SPICE (Super-fast, Parallel, In-memory Calculation Engine)
- Easily scalable with thousands of customers and terabytes of data.
- Provides SQL-like interface for other BI Tools to access data stored in SPICE.
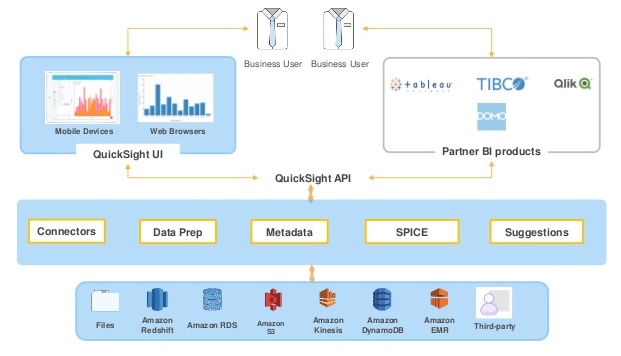 Fig 2: Working module of Amazon QuickSight (aws.amazon.com/quicksight/)
Most of the organizations using traditional BI solutions (SAP Business Objects/Crystal Reports, IBM Cognos, Oracle BI etc.) invest in substantial resources to get their first visualization. Agile BI solutions (Tableau, Qliksense, Sisense, Domo etc.) have their own constraints in terms of processing and customization capability, which limit their potential use.
Bearing in mind all these aspects, we need to ask, “Can Amazon QuickSight really kill the old guard BI services?” Let us take a look at some of the many crucial characteristics that we can consider to compare Amazon QuickSight with the market leader in BI services i.e., Tableau.
QUICKSIGHT v/s TABLEAU
Price:
Amazon QuickSight has come up with an extremely competitive pricing structure (90% less as compared to other BI products). Its standard edition is priced at $9 per month per user and the enterprise edition is priced at as low as $18 per month per user (one year contractual basis).
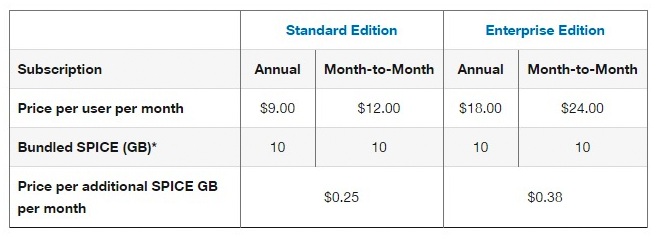 Fig 3: Pricing Structure for Amazon QuickSight (aws.amazon.com/quicksight/)
Tableau on the other hand has its cloud-based service (Tableau Online) starting at $500 per user per year. This gives QuickSight a huge edge over other competitors, especially while catering to small to medium enterprises, which are sensitive on budget.
Data Processing:
One of the major features of Amazon QuickSight is SPICE- a Super-fast, Parallel, In-memory Calculation Engine. Based on the technique of columnar storage coupled with in-memory technologies, SPICE helps in running queries at a lightning rate producing results in a few milliseconds with following salient features:
- 2 to 4x compression columnar data
- Compiled queries with machine code generation
- Rich calculations and SQL-like syntax
For the data to be analyzed using QuickSight it is mandatory for the data to be in SPICE. This enables organizations to scale their data to large volume without any additional overhead.
Tableau’s Data Engine is an in memory analytics, high-performing database on one’s PC. It uses memory mapped I/O, i.e. the data is loaded in disks after it is imported. This results in low usage of RAM which eventually provides the desired performance.
Target Group:
Both Amazon and Tableau, have a significant customer base ranging from small scale organizations to some of the top firms in the world. Nevertheless, AWS has been a promising player in providing customer satisfaction, as a result of which most of the organizations tend to use AWS for storing massive data. It makes sense here to say that Amazon will target its AWS users as potential customers for QuickSight. Many organizations are shifting their base from on-premise to AWS Cloud for several reasons. On the contrary, some enterprises still prefer to store their critical datasets on their local premise for legal and security reasons.
Ease of Use:
Amazon posits QuickSight as a self-discovery tool which does not require people to have in-depth knowledge about data visualization. Tableau on the other hand requires certain level of expertise.
Features:
Finding the right visualization for data is extremely important. QuickSight’s Autograph feature automatically predicts the best visual for your data to be displayed. Likewise, Tableau provides us with a “Show Me” which detects data based on data types, cardinality etc.
Limitations:
QuickSight is most appropriate for data that is stored in AWS’s cloud and also more importantly the data that can be put onboard SPICE. As quoted by Ashley Jaschke (Director, Product Management, Tableau) QuickSight will be suitable for lightweight visualizations. Many companies still keep their data outside of AWS’s cloud. Since, Tableau has a provision for ingesting data from multiple sources it has the ability to provide much deeper and significant insights.
QuickSight is currently available only as a preview version and it would be too early to decide as to whether QuickSight will dominate the BI services market, but it is surely poised to make a heavy impact.
Two Way Synchronization between Google Spreadsheet and AWS RDS using Google Apps Script
Two Way Synchronization between Google Spreadsheet and AWS RDS using Google Apps Script
![]() Google Spreadsheet can be a very nifty tool to satisfy dynamic data storage needs for any small to medium data analytics projects. Using Google Apps Script, Google Spreadsheet can fetch data from any RESTful API and act as an easily editable data source.
Google Spreadsheet can be a very nifty tool to satisfy dynamic data storage needs for any small to medium data analytics projects. Using Google Apps Script, Google Spreadsheet can fetch data from any RESTful API and act as an easily editable data source.
Google Spreadsheet can be directly used as a data source to most of the major analytical dashboard platforms like Tableau as well as operational dashboard platforms like Klipfolio. However, connectivity from Google Spreadsheet to Tableau is not perfectly stable yet and may run into issues on Tableau Server.
One way of getting a more robust method of connectivity from Tableau to Google Spreadsheet could be using an intermediate layer of RDS Database services of AWS. In Google Apps Script, the JDBC service supports, as standard, the Google Cloud SQL, MySQL, Microsoft SQL Server, and Oracle databases.
In this blog, we show you a step-by-step synchronization process of connecting Google Spreadsheet with Amazon’s RDS Web Service. We should bear in mind that Google Apps Script still does not provide connectivity to PostgreSQL DB.
Step 1:
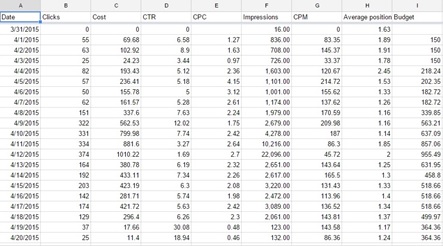
To demonstrate we have some dummy data on the Spreadsheet(Insights_Summary_Spreadsheet is the name of this Google Spreadsheet) which is extracted using RESTful APIs.
 Step 2:
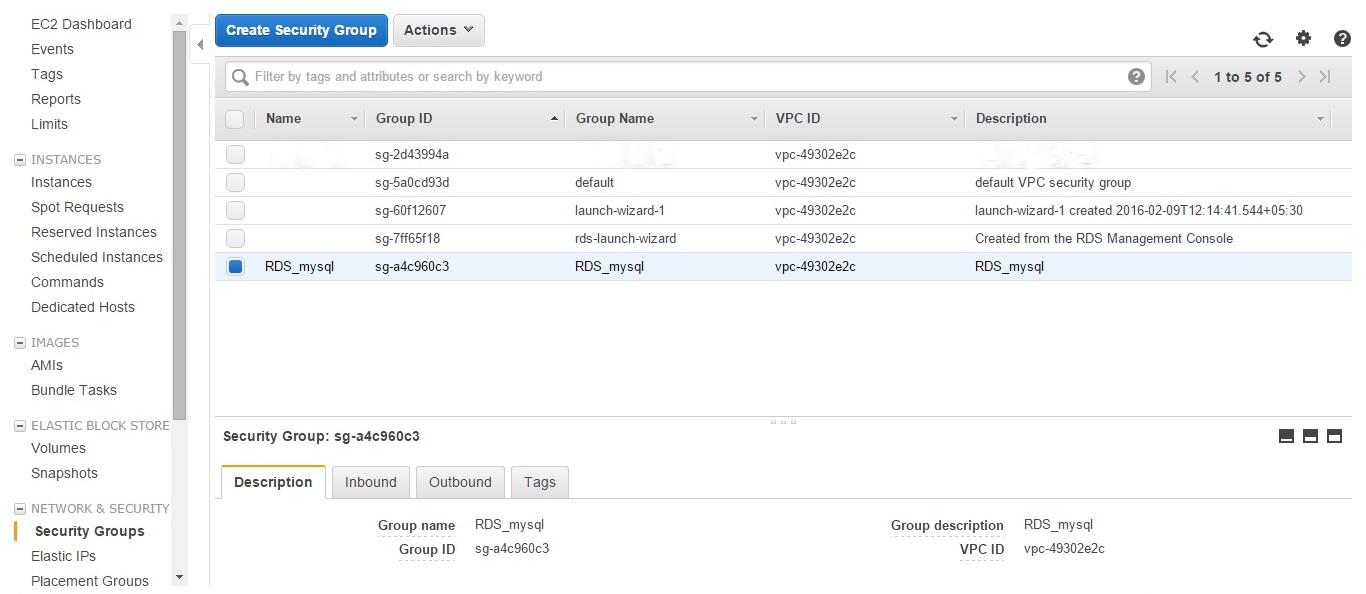
This data needs to be moved to the database on cloud (AWS RDS MySQL instance). So, the next step involves setting up an RDS MySQL instance on AWS. After having setup the basic RDS MySQL instance, we need to whitelist a few IP addresses to allow Google Apps Script to access your database. Following are the address ranges you’ll need to whitelist:
64.18.0.0 - 64.18.15.255
64.233.160.0 - 64.233.191.255
66.102.0.0 - 66.102.15.255
66.249.80.0 - 66.249.95.255
72.14.192.0 - 72.14.255.255
74.125.0.0 - 74.125.255.255
173.194.0.0 - 173.194.255.255
207.126.144.0 - 207.126.159.255
209.85.128.0 - 209.85.255.255
216.239.32.0 - 216.239.63.255
Note: JDBC Service does not connect to port lower than 1025. So make sure that you are not allocating a lower port.
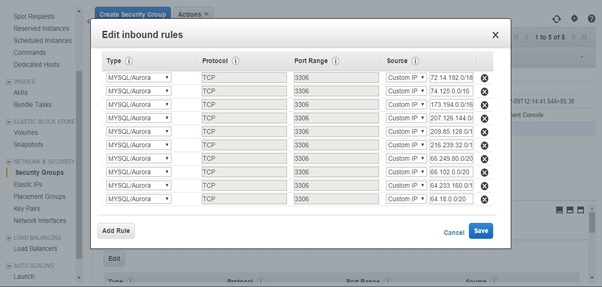
To add the above IPs to the security group, select the RDS instance and then Edit the Inbound section. Add Rule(IPs) as per requirement. Once this is done, you are ready with your RDS instance to work with Google Apps Script.
 Step 3:
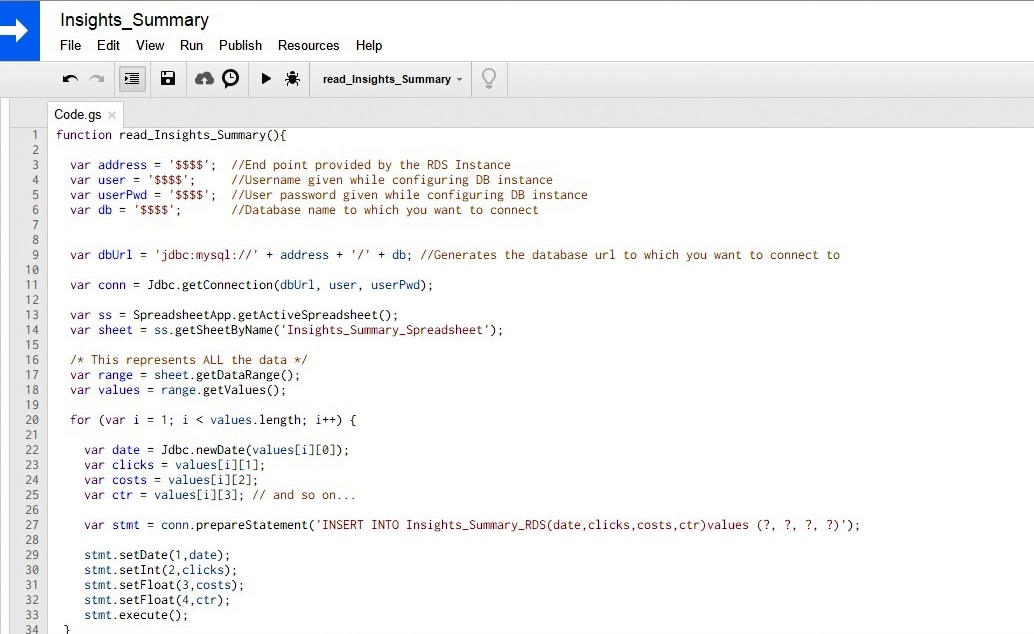
In this step we fetch data from Google Spreadsheet into RDS. We need to make a connection to the RDS instance using JDBC Service. In the Google Apps Script project we build the following code.
// Replace the variables in this block with real values.
var address = 'database_IP_address'; //End point provided by the RDS Instance
var rootPwd = 'root_password'; //Root password given while configuring DB instance
var user = 'user_name'; //Username given while configuring DB instance
var userPwd = 'user_password'; //User password given while configuring DB instance
var db = 'database_name'; //Database name to which you want to connect
var dbUrl = 'jdbc:mysql://' + address + '/' + db; //Generates the database url to which you can connect to
var conn = Jdbc.getConnection(dbUrl, user, userPwd);
Next, we build the code to select the spreadsheet from where we need to fetch the data.
var ss = SpreadsheetApp.getActiveSpreadsheet(); /* This represents the whole data */
var sheet = ss.getSheetByName('Insights_Summary_Spreadsheet'); /* Replace with your own spreadsheet name */
var range = sheet.getRange(); /* This represents the whole data */
var values = range.getValues();
Then using prepare statement we can insert data into RDS.
/* Query to insert fields into the table on RDS. Here Insights_Summary_RDS is the table created in RDS. */
var stmt = conn. prepareStatement('INSERT INTO Insights_Summary_RDS(date,clicks,costs,ctr,cpc,impressions,cpm,avg_pos,budget)values(?,?,?,?,?,?,?,?,?)');
stmt.execute();
 Step 4:
In this process we fetch data from RDS to Google Spreadsheet if required by our project. After establishing the Google Spreadsheet to RDS connection as shown previously, we build the following code:
var stmt = conn.createStatement();
var store_results = stmt.executeQuery('SELECT * FROM Insights_Summary_RDS');
The data returned from the query is stored in a variable called store_results. Now we need to write the records by using a looping structure until the end of the data in the store_results.
while (store_results.next()) {
var rowString = ' ';
for (var column = 0; column < numCols; column++) {
rowString += store_results.getString(col + 1) + '\t';
}
}
store_results.close();
stmt.close();
Eventually a simple Google Apps Script can help us build a great analytical dashboard to get enhanced insights from the data.